

Most customer support KPIs measure activity. Messages handled, conversations opened, average response time – numbers that go up when you are busy and tell you almost nothing about whether customers got what they needed.
Five numbers will tell you that, and five is roughly the limit of what anybody actually reads each month. The discipline is choosing them deliberately, writing down what each means, and not adding a sixth when a month looks bad.
This is the set, the cadence for each, and the four ways support reporting misleads without anyone intending it. For the underlying argument about what support automation is for, see customer support automation.
Key takeaways
- Five metrics, three cadences. Response time weekly, resolution and repeat contacts monthly, escalation reasons read rather than counted.
- Time to first useful reply is the headline – it moves within days and predicts reviews.
- Repeat-contact rate is the one that catches answered-fast-answered-wrong.
- Escalation reasons are a roadmap, not a score. Read them; do not graph them.
- Publish median, mean and the 90th percentile together – the tail is where complaints live.
- Write each definition down once and never change it mid-quarter.
- Deflection, CSAT and messages-sent are deliberately absent from this list.
The Five
Each earns its place by changing a decision. If a number cannot change what you do next week, it is not a KPI.
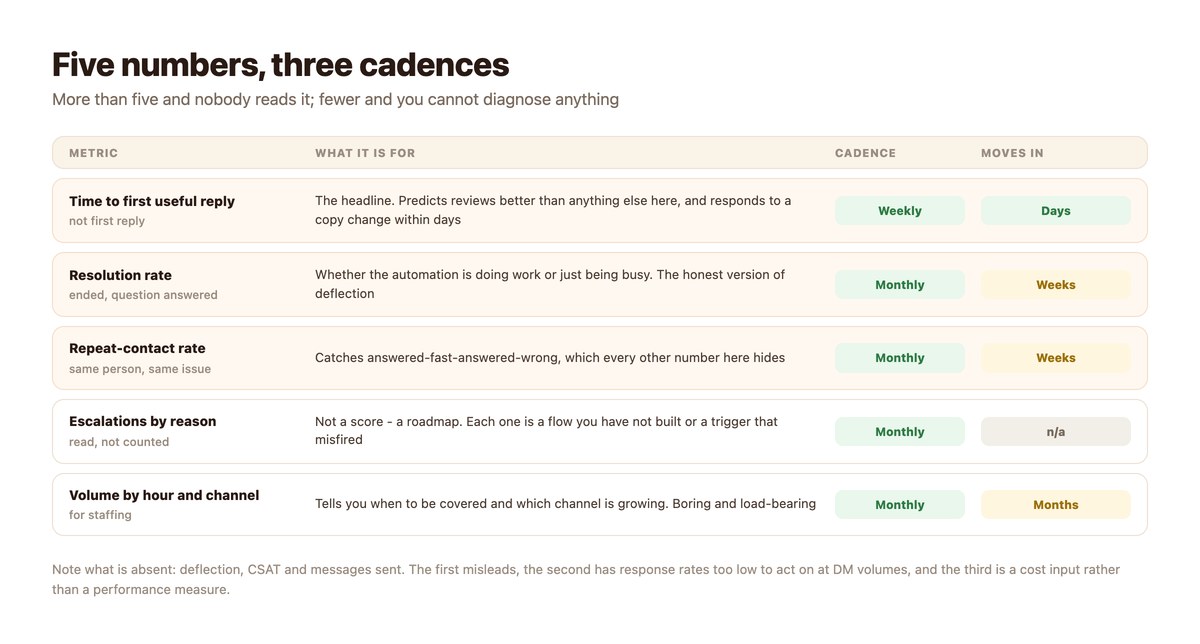
Time to First Useful Reply
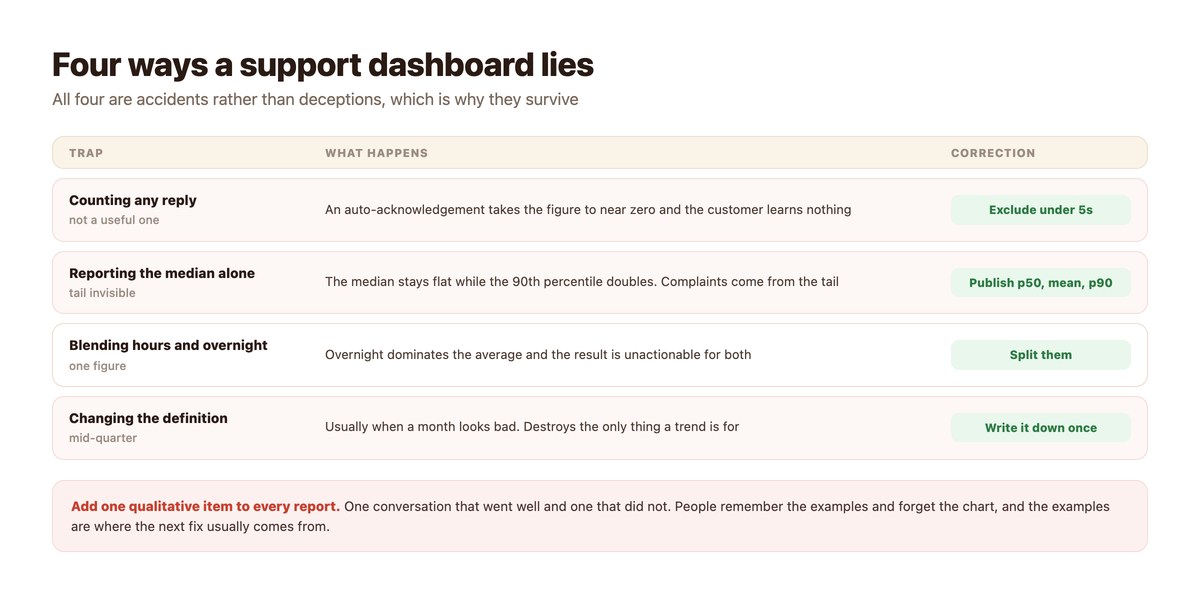
The headline, and the one most worth getting right. Not time to first reply – an automatic acknowledgement satisfies that in under a second while the customer still knows nothing.
Measure the gap until they learn something: an answer, a date, a next step. It responds to a wording change within days, which makes it the only metric here worth looking at weekly. Detail in how fast you actually reply.
Resolution Rate
Conversations that ended because the customer got what they came for. This is the honest version of deflection and the number to use when somebody asks whether the automation is working.
It moves in weeks rather than days, so monthly is the right cadence. Why the distinction from deflection matters is the whole of DM ticket deflection.
Repeat-Contact Rate
The same person, about the same issue, within a week. This is the only number on the list that catches a fast wrong answer, and every other metric will look excellent while it happens.
It is also the cheapest quality signal available: no survey, no sampling, just a query.
Escalations by Reason
Not a score. A list to read. Every escalation is either a flow you have not built or a trigger that fired when it should not have, and twenty minutes a month reading them will tell you more than any chart.
Graphing this number is the mistake – it tempts people to drive it down, and the way to drive it down is to escalate less, which is the wrong direction.
Volume by Hour and Channel
Boring, load-bearing. It tells you when coverage is needed and which channel is growing, which are the two questions a support plan has to answer.
It is also what makes the overnight decision concrete rather than theoretical – see the after-hours coverage models.
What Is Deliberately Missing
Three popular metrics that are not on the list, and why.
Deflection
It rises when the automation is good and equally when it is so unhelpful that people give up, and nothing in the number distinguishes the two. Resolution rate answers the same question without the ambiguity.
Keep it only if finance has asked for it, report it with its definition attached, and put it last.
CSAT and NPS
Not wrong, just impractical at DM volumes for most businesses: response rates are low enough that monthly movements are noise, and asking for a rating inside a messaging thread annoys a meaningful fraction of people.
If you want a satisfaction signal, repeat-contact rate is a better proxy and costs nothing to collect.
Messages Sent
A cost input, not a performance measure. It matters for forecasting against Meta’s free monthly allowance and for nothing else.
Keep it in the cost model rather than on the support dashboard, where it will be misread as productivity.
The Reporting Pack
What a monthly support report should contain. One page.
| Section | Contents | Length |
|---|---|---|
| The headline | Time to first useful reply: p50, mean, p90, split in/out of hours | Four numbers |
| Quality | Resolution rate and repeat-contact rate, with last month beside them | Two numbers |
| What we learned | Escalation reasons, grouped, read not graphed | A short list |
| Two conversations | One that went well, one that did not, quoted | A paragraph each |
| What changes next month | One or two things, named owner | Two lines |
| Cost | Messages against the free allowance, forecast | One number |
Turning the cost line into an argument finance will accept is a separate exercise – reducing support costs with automation does it properly.
Setting the Dashboard Up
Half a day, then fifteen minutes a week.
- Write each definition down before computing anything. Especially what counts as a useful reply and what counts as a repeat contact. Put them in the same document as the numbers.
- Record four weeks of baseline. Nothing afterwards is interpretable without it, and this is the step people skip because they want to start improving.
- Split in-hours from out-of-hours on every time metric. A blended figure is dominated by overnight and actionable for neither.
- Report p50, mean and p90 together. Always all three. The tail is where complaints come from and the median hides it.
- Read escalation reasons monthly, in full. Twenty minutes. Do not graph them.
- Add the two conversations. One good, one bad, quoted. This is what makes the pack get read and where the next fix usually comes from.
Reading It Without Fooling Yourself
Three habits that separate a dashboard from a decoration.
Expect Improvements to Look Bad First
Make the route to a human easier and deflection falls. Answer more honestly and escalations rise. Both are the system working, and both will look like regressions on a chart nobody annotated.
Annotate the chart. One line per change, with the date.
Never Add a Metric in a Bad Month
The strongest signal that a dashboard has become political is a new number appearing the month an old one went the wrong way. Fix the thing or explain the thing; do not re-scope the measurement.
Know What You Would Turn Off
A flow that fires constantly and resolves nothing should be retired by you, visibly, before anyone else notices. Having already switched something off is the strongest position in any review.
That judgement comes from escalation reasons and repeat contacts, not from the headline number.
Where This Connects
Two places the numbers stop being numbers.
When They Point at Tooling
If response times are fine in aggregate but the p90 is dreadful, the usual cause is conversations nobody owned rather than capacity – which is the threshold question in shared inbox vs helpdesk.
When They Point at a Mistake
Several of the patterns these metrics expose are well-worn enough to be worth reading about in advance rather than discovering – support automation mistakes collects them.
Measure Whether People Got Helped
Activity metrics go up when you are busy. The numbers worth tracking are the ones that change what you build next week – and most dashboards contain none of them.
DMpro answers the predictable questions instantly, routes the rest to a named person with the whole conversation attached, and leaves you a clean split between what the automation resolved and what actually needed somebody.
Conclusion
Five numbers is the right size for a support dashboard: time to first useful reply, resolution rate, repeat-contact rate, escalation reasons and volume by hour and channel. Each one changes a decision; anything that does not is decoration.
Write the definitions down once, split in-hours from overnight, publish the 90th percentile alongside the median, and never add a metric in a month that looked bad.
Then put two real conversations in the report – one that went well and one that did not. The charts get skimmed; the conversations get remembered, and they are usually where the next improvement comes from.
Frequently asked questions
What support metrics should I track for DMs?
Five: time to first useful reply, resolution rate, repeat-contact rate, escalation reasons and volume by hour and channel. Response time weekly, the rest monthly.
Why not track deflection?
Because it rises when the automation is good and equally when it is unhelpful and people give up. Resolution rate answers the same question without the ambiguity – keep deflection only if it was specifically requested, and report its definition with it.
What is repeat-contact rate?
The same customer coming back about the same issue within about a week. It is the only metric that catches a fast wrong answer, and every other number looks excellent while that is happening.
Should I use CSAT for DM support?
Usually not. Response rates are low enough at DM volumes that monthly movements are noise, and asking for a rating inside a messaging thread irritates a meaningful share of people. Repeat-contact rate is a cheaper proxy.
Median or average response time?
Both, plus the 90th percentile. The median hides how bad the tail is, the average is dragged by a single stalled conversation, and complaints come from the tail.
How often should escalation reasons be reviewed?
Monthly, read in full rather than graphed. Graphing tempts people to drive the number down, and the way to drive it down is to escalate less – which is the wrong direction.